Trading Case ST1
Case Objectives
To understand how a market maker hedges the price
risk from inventory changes by applying delta hedging and other delta based
option trading strategies. To gain
experience with real world option support systems.
Key Concepts
Delta hedging and trading in a world where prices
evolve in continuous time but trading takes place at discrete points in time (approximately
every two weeks*). Trading takes place
in an idealized constant volatility
world. You get to adjust your position
at realized bi-weekly prices.
Case
Environment
In this case you will be
trading for a firm that makes money from trading options for clients at a
"premium" above its estimated competitive market price. Your trading problem is to hedge this source of profit from option
trading activities.
In the FTS markets, stock
prices will evolve in continuous time, but you can trade only at discrete
points in time. Your trading performance
is evaluated by the amount of money you make as well as ensuring that the
market value of your position does not fall below a pre-specified floor. This guarantees that the profits from option
trading activities do not fall below target levels.
In the FTS markets you
will have access to a set of real-time analytical support tools that enable you
to monitor the delta of your position
at each point in time. The description
of how to link the FTS Trader to the real time support system is described at
the end of this case.
Market Environment
The Stock Market
The stock market trades
the stock of IMB, a large computer manufacturer. Although this stock has suffered from major
price corrections over it's recent history, analysts
expect that these corrections are finished.
The following statistical process describes how prices are expected to
evolve over the next twelve months:
|
Volatility of return (): |
30% per annum |
|
Spot Price: |
346.826 |
|
Drift (): |
5% per annum |
|
Unit of Time: |
Approximately 2 weeks
(15 seconds FTS time divided by 375 seconds in default case) |
In addition, due to the
recent weakness in the IMB stock, analysts forecast no dividend payments over
the next twelve months.
Trading in this stock is
permitted at the displayed bid/ask prices that are updated bi-weekly. At the end of twelve months each share you
own is marked to the realized market price.
The Treasury Strip Market
The second security
market trades a zero-coupon bond with zero default risk. This is known as a Treasury strip. This strip security pays $900 at the close of
the market regardless of which path the stock market takes.
The European Options Markets
The
The time to maturity for
each option is approximately twelve months and the terminal payoff for each
option depends upon the realized value for IMB after the FTS markets are
closed.
For example, options with
a strike price equal to 320, have the following
terminal values:
Terminal value:
![]()
At the end of their life,
options are automatically exercised if they are "in the money."
Trader Endowments
As traders your task is
to manage the exposure of your position to price
risk. There are two types of initial
trading endowments that you may start with.
These are referred to as type A and type B. Each position type reflects the different
option trading activities of a firm.
If you are type A then
you have an initial non-tradable position in call options. If you are type B this non-tradable position
is in put options.
|
Type A |
Endowments |
|
Treasury Strips |
113 units |
|
Call 320 |
-1,000 shares |
|
Put 320 |
0 |
|
Call 360 |
0 |
|
Put 360 |
0 |
|
Type B |
Endowments |
|
Treasury Strips |
45 units |
|
Call 320 |
0 |
|
Put 320 |
+1,000 |
|
Call 360 |
0 |
|
Put 360 |
0 |
Implicit in each initial
position is a "profit" from trading call options (put options) with
clients at prices slightly higher than theoretical prices.
In both cases this profit
is approximately $53,500 market cash, and your trading objective is to lock
into a floor to this profit for the firm.
Trading Restrictions
You can trade in the
stock and the treasury strip markets. Up
to 10000 shares can be purchased or sold in these markets in any one
transaction (i.e., one click of the mouse).
You can trade a large number by repeating a transaction many times.
Option trading is not
permitted. As a result, you must manage
your position's exposure to price risk by only trading in the stock and
treasury markets.
Shortselling
in the stock and treasury markets is permitted. This allows you to borrow (lend) at
the risk-free rate by shortselling (buying) treasury
strips.
Holding market cash pays
zero interest and borrowing is not permitted in the cash market. If you want to buy securities but have
insufficient cash you must first shortsell the
required amount of treasury strips and then purchase the desired amount of
stock.
The spot risk-free rate
of interest for a Treasury strip is currently 3.25% per annum
. This rate is not expected to
change over the next twelve months.
Trading Objective
Your trading objective is
to earn as much grade cash as
possible.
Earning Grade Cash
You can make money by
buying and selling securities for market cash over approximately twelve months
of calendar time. This period of time is
referred to as one trading trial.
At the start of a trial
your initial endowment is either type A or type B, and an independent path for
the stock prices is generated (starting from the spot price of 347).
If at the end of any
trial you have a closing balance of $45,000 market cash then you will earn $6
of grade cash. If you have a closing
balance of market cash that is lower than $45,000 then you will earn $0 of
grade cash. Any amount of market cash
that is greater than $45,000 and less than or equal to $200,000 earns grade
cash as follows:
![]()
Above $200,000 market
cash earns the maximum grade cash for one trial which is $10.
Trading is conducted over a number of independent
trials and a record of your cumulative grade cash is maintained.
Linking to the Trading
Support
Download the trading support spreadsheet from the
Virtual Classroom page and open it in Excel.
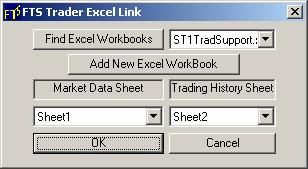
Launch the FTS Trader and link to the market. In FTS Trader click on the File menu and
select Excel Link from the sub menu items.
The following screen will pop up.
Select the spreadsheet titled ST1TradSupport and be sure to select Sheet
1 as the Market Data Sheet and Sheet 2 as the Trading History Sheet as depicted
below:
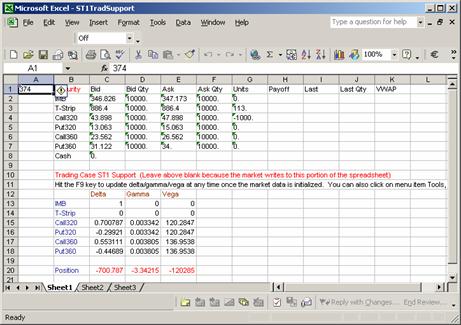
Click OK and the spreadsheet is automatically linked
to the market. By giving focus to the
spreadsheet (i.e., resize so it is on the same screen as your trading window),
you can see your position Greeks update in real time. The spreadsheet support is illustrated below:
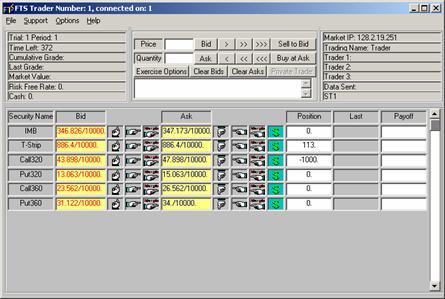
Corresponding
Trading Screen in the FTS Trader
Notes:
* The exact
length of time a period maps into is 15 seconds between ticks divided by a
total of 375 seconds for the year. So
this is just over 2-weeks (0.04*52 = 2.08).