 Fast Start to Portfolio
Analysis
Fast Start to Portfolio
Analysis Restart to return home
Fast Start to Portfolio
Analysis
In this exercise we will use the Webs securities, which are International Exchange Traded Funds on the Amex Exchange. To read the the background information on these click on International Funds.
In this exercise we will use weekly price history from May 1996 to November 2001. To use Portfolio Analysis we must first link the module to our spreadsheet. This is easy.
Step 1: Download the weekly price history for the international exchange traded funds by clicking on the hypertext webs.xls.
Warning: If you are running Internet Explorer 5.0 or better, it will prompt you to open Excel directly in the Browser. Although this will work we do not recommend doing so. You should select Save (save to a local folder and then open Excel and launch the spreadsheet) BEFORE starting Step 2. The reason we recommend taking a couple of extra steps here is that Internet Explorer does not always release the handle to Excel which sometimes creates later problems in your session, if you plan on using Excel with the FTS Modules.
Step 2: Click on the button Find Excel Worksheets. Select the sheet [webs.xls]Sheet1 (if you have other worksheets open then you will need to select the webs spreadsheet from the drop down menu. This is a Smart Worksheet so click on the Process Selected Sheet button and all settings will automatically be updated in the module.
Step 3: Click OK to proceed.
You are ready to proceed to the data analysis section. Click on the top button Data Analysis.
Step 4: This lets you perform portfolio statistics analysis on the data. For example from the drop down menu (below Plot Return Histogram) select Equally Weighted. This lets you explore the statistics associated with a Naively Diversified (i.e., equally weighted) portfolio of these webs securities. You can Plot the histogram and check normality and more.
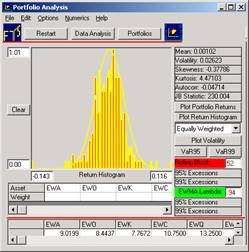
You can plot returns or volatility.
Plotting Volatility: You will see how volatility has increased in the latter part of 2001 especially if you play with the rolling block size (i.e., the number of weeks (because we are using weekly data) used to estimate the volatility).
You can look at country indexes individually by turning on or off assets or giving the weight equal to 1 for the country of interest and zero otherwise.
Step 5: Select Market Model via the Checkbox. In the central grid you will see the beta of each countries exchange traded fund relative to the S&P500 index (including the beta of the exchange traded fund the SPY which is designed to replicate the S&P500 index).
Step 6: Click on the Portfolios button to use Markowitz Diversification.
You can compute and plot the Efficient Frontier (with and without short sales permitted). Then plot the individual securities in Risk/Return space to observe where they lie relative to the minimum variance frontier.
You can calculate a specific target return directly, by selecting Target from the drop down, entering the number (scaled to your unit of measure (i.e., monthly return if using monthly price data) and you will see the volatility associated with this portfolio and the portfolio weights automatically displayed.
You can calculate portfolios along the visually depicted efficient frontier by left clicking your mouse on the efficient frontier. You will see the corresponding weights automatically displayed.
You can read off the return and risk associated with any portfolio along the visually depicted efficient frontier by right clicking your mouse on the efficient frontier. You will see the corresponding pair of numbers (volatility, return) displayed below the x-axis.
You can explore the dynamics of the efficient frontier over the time 1996-2001 by clicking on Animate and much more!
The purpose of this exercise is to provide a fast start to using this powerful module. If you want to bring this data file up to current date you can do this easily by using Historical Data Collection FTS Module to automatically retrieve the current Webs data.
Exercise: In the above screen the Market Model is not highlighted. To work with these parts of the module (e.g., Single Index Approach, betas and CAPM) you need to modify the spreadsheet to add one additional column, a global index. Once you read in the appended data you must specify one security as a Proxy for the Market Index (i.e., create an additional Global Index for example using MSCI world Index). Specifying it as an Index is simple, first you click beside the label "Index Data" and then in Step 4 above you click on security that is to be the Index and press Shift + I. This tells the module that this security is to be treated as an Index.
If you introduce a Global Index such as the historical MSCI data, this will let you compute country specific betas etc., automatically relative to the MSCI Index.
OS Financial Trading System, PO Box 11356, Pittsburgh, PA 15238 USA, Phone 1-800-967-9897, Fax 1-412-967-5958, Email fts@ftsweb.com,
(C) Copyright 2000, OS Financial Trading System