![]() Convergence to the Black Scholes model
Convergence to the Black Scholes model
Explain the pattern of convergence from the binomial model of option pricing and the Black-Scholes model.
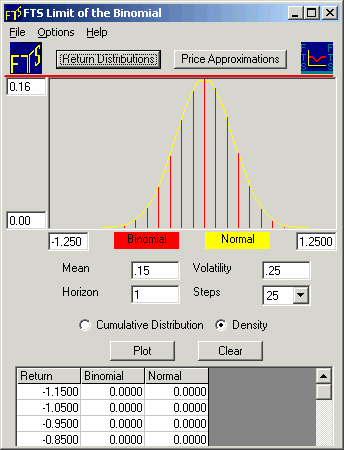
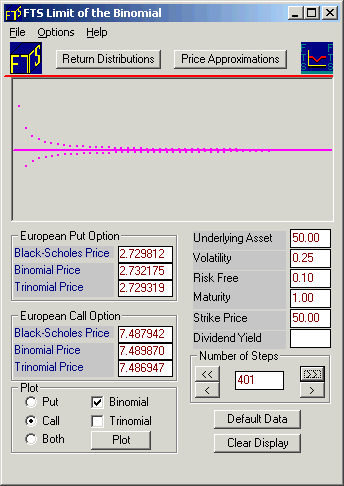
To solve this exercise, run the Binomial Tree: Limiting Behavior Module from the Virtual Classroom. When you do, you will see the following:
Click on the button Price Approximations.
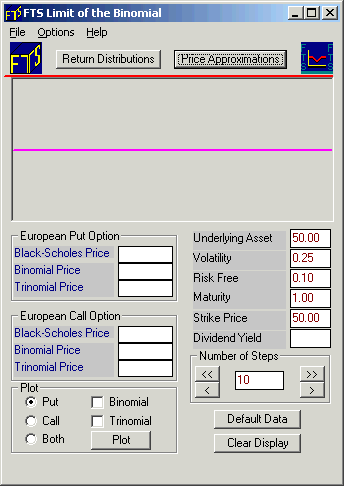
The above screen will compute the Black-Scholes price for the parameters shown on the right. You can change the number of steps in the binomial approximation, and the program will plot the binomial price and the Black-Scholes price in the Display part of the screen. The program also allows you to conduct the same exercise with the trinomial model.
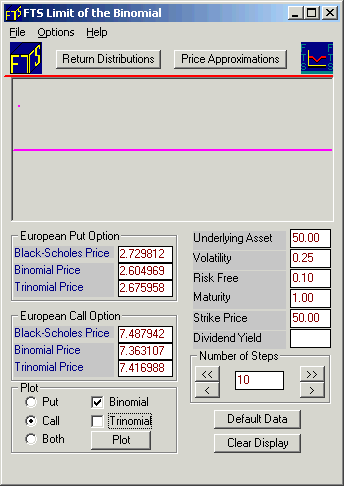
Let us start with the call option (click beside Call). Click the Plot button to reveal the Black-Scholes price (7.4879). With 10 steps, the binomial price is 7.3631. The dot plotted in the Display Window shows you the difference between the Black-Scholes price and the binomial price. With 10 steps, the deviation is positive so the dot is plotted above the horizontal line as displayed below:.
Now, click the “>>“ button twice followed by the “>“ button once, carefully noting where the dots are plotted. Your Display Window will appear with additional dots as follows:
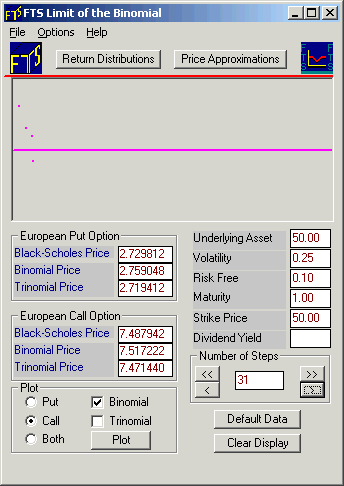
Note how the 10, 20, and 30 steps binomial prices calculations are below the Black-Scholes price while the 31 step price is above the Black-Scholes price.
If you repeat this a few times, you will see that with an even number of steps, the binomial price approaches the Black-Scholes price from below, while with an odd number of steps, it approaches from above. In other words, the convergence pattern is not monotonic, but oscillatory.
Note: You
should examine this conclusion for the call option, and also see whether it
depends on the underlying parameters.
©2003 OS
Financial Trading System