How do the factors influence the estimation of the minimum variance frontier?
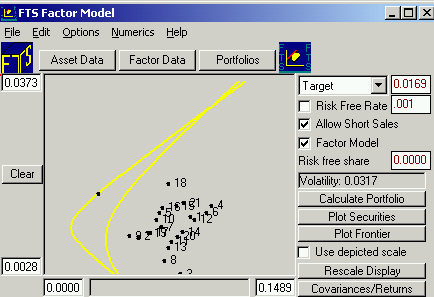
In the upper part of the module click on the button Portfolios. First, we plot the minimum variance frontier computed from the subset of S&P100 stocks over the period from 1970 to 2001.
Check Allow Short Sales but leave unchecked Risk Free Rate and Factor Model.
Click on the button Plot Securities ( to see how they line up individually in risk and return space).
Click on the button Plot Frontier. You will see that lies substantially to the left of the individual securities. This reflects the fact that a lot of firm specific risk is diversified away by forming portfolios.
Next check beside Factor Model and re-plot the frontier. Now you can observe significant additional movement to the left. That is, by including the factors the adjusted minimum variance frontier dominates (provides more return for less risk or less risk for a given level of return) the unadjusted minimum variance frontier over the range of non extreme returns.
This suggests that there are potential gains to exploiting factor information when building a portfolio.
You can check specific portfolios constructed from either frontier by clicking on the frontier and inspecting the target return, volatility and portfolio weights associated with the point depicted.
Note 1: With both minimum variance frontiers displayed on the screen you can click on the one associated with the check box (Factor Model). That is, if Factor Model is checked you can click on the minimum variance frontier lying closest to the Y-axis (i.e.,using factors). If Factor Model is unchecked then you can click on the traditional Markowitz frontier (constructed without factors).
Note 2: Right clicking your mouse anywhere in the Risk and Return space displays the coordinates of the point clicked on.