What is the Cost of Equity Capital?
In this step we will estimate the cost of equity capital using the Security Market Line as derived from the Capital Asset Pricing Model Theory.
Security Market Line (SML): This is the line that all assets, risky and riskless are predicted from CAPM to lie on. In this theory of asset pricing investors are rewarded for holding general market or systematic risk. A measure of this risk is provided by a security's beta. Beta captures the contribution of a risky asset to the general volatility of the market as a whole.
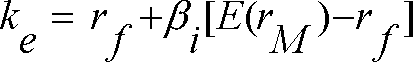
The SML is a predicted linear relationship between beta and expected return. The expected return from a stock equals the risk free rate plus the product of beta and the equity risk premium (= expected return from the market as a whole minus the risk free rate). The equation is illustrated above where the left side is the cost of equity capital.
The SML is widely used as an estimate of the cost of equity capital.
In a two stage abnormal growth model analysts typically estimate two cost of equity capital numbers. That is, a different cost of equity capital is applied to each stage. Some reasons for this are that it is typically observed that beta mean reverts over time. That is, if beta is high (greater than one) then it tends to drift towards one over time and vice versa. In addition, if a stock has high abnormal growth in stage I then typically (but not always) it has a high beta. As a result, when assuming a lower growth in stage II it is natural to reduce the estimate of beta.
Cost of Equity Capital: The Inputs
Three inputs are estimated:
i. The risk free rate
ii. Beta
iii. The equity risk premium (defined as the expected return from the market as a whole less the risk free rate).
Risk Free Rate
The Security Market Line comes from the single period Capital Asset Pricing Model theory where the size of the period is left unspecified. However, in an intrinsic value analysis we are projecting long term under the assumption that the firm is a going concern (lives forever). In our default example illustrated above, we use the 30-year Treasury rate.
The current value for this can be retrieved from either the Reuters or Bloomberg web site. You should select the current treasury rate that is consistent with your investment horizon (e.g., 10-years, 20-years, or 30-years if you are a long tern investor).
Beta
Most investor web sites provide beta estimates these days. For example, go to Yahoo investor and enter the stock ticker and then click on Profile. By scrolling down you will see a current estimate for beta.
Equity Premium
The equity premium has been subject to intense debate over the latter part of the 1990's into 2000. A significant puzzle arises from the fact that the equity premium is historically larger than economist's estimates of risk aversion can explain --- and by a large degree. For example estimates ranging between 5.5% to 7.5% over long bonds are not unusual given last century's observed data. Towards the latter part of the 1990's there was increasing speculation in the US at least, that the equity premium had narrowed considerably given the run up of the US stock markets. This led to discussions by Greenspan and others as to whether this was a temporary or permanent phenomena (e.g., Measuring Financial Risk in the Twenty-first Century (Alan Greenspan October 14, 1999). In the default case above 5% is used.
Next we consider how to estimate the cost of equity capital using the FTS Free Cash Flow module.